<?xml version="1.0" encoding="utf-8"?><feed xmlns="http://www.w3.org/2005/Atom" ><generator uri="https://jekyllrb.com/" version="3.10.0">Jekyll</generator><link href="https://blog.aaryanmehta.com/feed.xml" rel="self" type="application/atom+xml" /><link href="https://blog.aaryanmehta.com/" rel="alternate" type="text/html" /><updated>2026-06-22T06:15:00+00:00</updated><id>https://blog.aaryanmehta.com/feed.xml</id><title type="html">Aaryan Mehta</title><subtitle>Aaryan Mehta writing about projects, tech, life, and whatever&apos;s been on my mind. No theme, no schedule.</subtitle><author><name>Aaryan Mehta</name></author><entry><title type="html">40× faster ingest in a weekend (and chasing the bottleneck all the way down to Postgres)</title><link href="https://blog.aaryanmehta.com/2026/06/21/40x-faster-ingest.html" rel="alternate" type="text/html" title="40× faster ingest in a weekend (and chasing the bottleneck all the way down to Postgres)" /><published>2026-06-21T00:00:00+00:00</published><updated>2026-06-21T00:00:00+00:00</updated><id>https://blog.aaryanmehta.com/2026/06/21/40x-faster-ingest</id><content type="html" xml:base="https://blog.aaryanmehta.com/2026/06/21/40x-faster-ingest.html"><![CDATA[<p class="post-dek">Notes from a weekend spent profiling Provenance’s submission ingest, finding an O(n²) bug that was hiding in plain sight, and chasing the cost around the pipeline until it finally landed on the database.</p>

<p>So. This was a weekend.</p>

<p>Provenance records a tamper-evident log of how a student actually wrote their code, and then ingests those logs: parse the bundle, match it to a roster, run heuristics, compute stats, and cross-check across the cohort. The question I wanted answered was simple: can this thing actually handle a real class?</p>

<h2 id="the-part-where-i-was-delighted">The part where I was delighted</h2>

<p>I built a fixture that modeled a real Gradescope export, 700 students with one bundle each, and ran the ingest. About a second per bundle, ~10 minutes for the whole class. I was pretty pleased with myself.</p>

<p>Then I noticed each of those 700 bundles only had about 20 events in it. A student who’d barely typed. So, just for the memes, I made one fixture with <strong>50,000 events</strong>, roughly a 4-hour working session, which is <em>extremely</em> possible on a real project.</p>

<p>That was a worse idea than it sounds. Time ballooned. A single 50k-event bundle took about <strong>two minutes</strong> to ingest. If 700 students each turned in something that size, that’s north of <strong>23 hours</strong> of ingest for one assignment, which is obviously not a thing you can hand to course staff.</p>

<h2 id="the-hunt">The hunt</h2>

<p>I’d built a little profiler earlier, gated behind an env flag so it’s a no-op in prod,<sup id="fnref:profiler" role="doc-noteref"><a href="#fn:profiler" class="footnote" rel="footnote">1</a></sup> so I switched it on to see where the two minutes were going. Most of it was in heuristics, with stats close behind and validation trailing:</p>

<div class="language-plaintext highlighter-rouge"><div class="highlight"><pre class="highlight"><code>$ INGEST_PROFILE=1 npm run profile:large -- 50000

─── ingest profile · one 50k-event bundle ───
phase                    total     share
parse_bundle             0.21s      0.2%
materialize_events       2.50s      1.9%
run_validation          15.60s     11.8%
compute_stats           47.70s     36.0%
run_heuristics          66.30s     50.0%
──────────────────────────────────────────
handler_total          132.50s
</code></pre></div></div>

<p>Then I ran a 10k-event bundle to check the scaling. The time dropped by about <strong>24×</strong>, not the 5× you’d expect from 5× fewer events. That’s the signature of quadratic time, and it wasn’t one stage, it was three of them (heuristics, stats, and validation) all scaling like O(n²).</p>

<p>I’ll be honest about this part: I spent hours here. I tried to get Claude to find it agentically and it kept confidently pointing at the blob-storage step, which the profiler plainly showed was not the problem. So I gave up on that and read every function that runs on ingest by hand.</p>

<p>It turned out to be the file-reconstruction code, the part that replays a session’s edits to rebuild what the file looked like at each step. There was a helper that converted an editor position into a string offset, and it looked like this:</p>

<div class="language-ts highlighter-rouge"><div class="highlight"><pre class="highlight"><code><span class="kd">function</span> <span class="nx">positionToOffset</span><span class="p">(</span><span class="nx">content</span><span class="p">:</span> <span class="kr">string</span><span class="p">,</span> <span class="nx">line</span><span class="p">:</span> <span class="kr">number</span><span class="p">,</span> <span class="nx">character</span><span class="p">:</span> <span class="kr">number</span><span class="p">):</span> <span class="kr">number</span> <span class="p">{</span>
  <span class="kd">const</span> <span class="nx">lines</span> <span class="o">=</span> <span class="nx">content</span><span class="p">.</span><span class="nx">split</span><span class="p">(</span><span class="dl">'</span><span class="se">\n</span><span class="dl">'</span><span class="p">);</span> <span class="c1">// ← O(file length), on EVERY call</span>
  <span class="kd">let</span> <span class="nx">offset</span> <span class="o">=</span> <span class="mi">0</span><span class="p">;</span>
  <span class="k">for</span> <span class="p">(</span><span class="kd">let</span> <span class="nx">l</span> <span class="o">=</span> <span class="mi">0</span><span class="p">;</span> <span class="nx">l</span> <span class="o">&lt;</span> <span class="nx">line</span><span class="p">;</span> <span class="nx">l</span><span class="o">++</span><span class="p">)</span> <span class="nx">offset</span> <span class="o">+=</span> <span class="nx">lines</span><span class="p">[</span><span class="nx">l</span><span class="p">].</span><span class="nx">length</span> <span class="o">+</span> <span class="mi">1</span><span class="p">;</span>
  <span class="k">return</span> <span class="nx">offset</span> <span class="o">+</span> <span class="nx">character</span><span class="p">;</span>
<span class="p">}</span>
</code></pre></div></div>

<p><code class="language-plaintext highlighter-rouge">content.split('\n')</code> over the entire current file body, called twice for every edit (once for the start of the change, once for the end), inside the replay loop. The file grows as you replay it, so you’re splitting a longer and longer string on each of n events, which is where the O(n²) comes from. The same helper had also been copy-pasted (oh dear) into three files that have to stay in lockstep,<sup id="fnref:lockstep" role="doc-noteref"><a href="#fn:lockstep" class="footnote" rel="footnote">2</a></sup> so it was really three quadratics wearing a trench coat.</p>

<h2 id="the-fix-and-a-cascade-of-others">The fix, and a cascade of others</h2>

<p>The fix was to stop re-splitting. I kept an incremental index of where each line begins, updated from the edit metadata as the replay runs, so a position lookup became O(1) instead of O(file length):</p>

<div class="language-ts highlighter-rouge"><div class="highlight"><pre class="highlight"><code><span class="c1">// lineStarts[i] = byte offset where line i begins, maintained per edit</span>
<span class="kd">function</span> <span class="nx">offsetAt</span><span class="p">(</span><span class="nx">lineStarts</span><span class="p">:</span> <span class="kr">number</span><span class="p">[],</span> <span class="nx">line</span><span class="p">:</span> <span class="kr">number</span><span class="p">,</span> <span class="nx">character</span><span class="p">:</span> <span class="kr">number</span><span class="p">):</span> <span class="kr">number</span> <span class="p">{</span>
  <span class="k">return</span> <span class="nx">lineStarts</span><span class="p">[</span><span class="nx">line</span><span class="p">]</span> <span class="o">+</span> <span class="nx">character</span><span class="p">;</span> <span class="c1">// no split, no scan</span>
<span class="p">}</span>
</code></pre></div></div>

<p>I also stopped rebuilding the parallel provenance array on every edit and mutated it in place instead. There’s a property-based fuzz test that runs the new reconstructor against the old one over 1,000 random edit streams and asserts byte-identical output, because this code is load-bearing and I did not want to be quietly wrong about it.</p>

<p><img src="/assets/img/quadratic-vs-linear.png" alt="Quadratic vs linear: the same append edits replayed through the old split-per-lookup loop and the new incremental-lineStarts loop. The old line climbs to 38.9 seconds at 50k events while the new one stays flat under 0.2ms." /></p>

<p class="fig-caption">
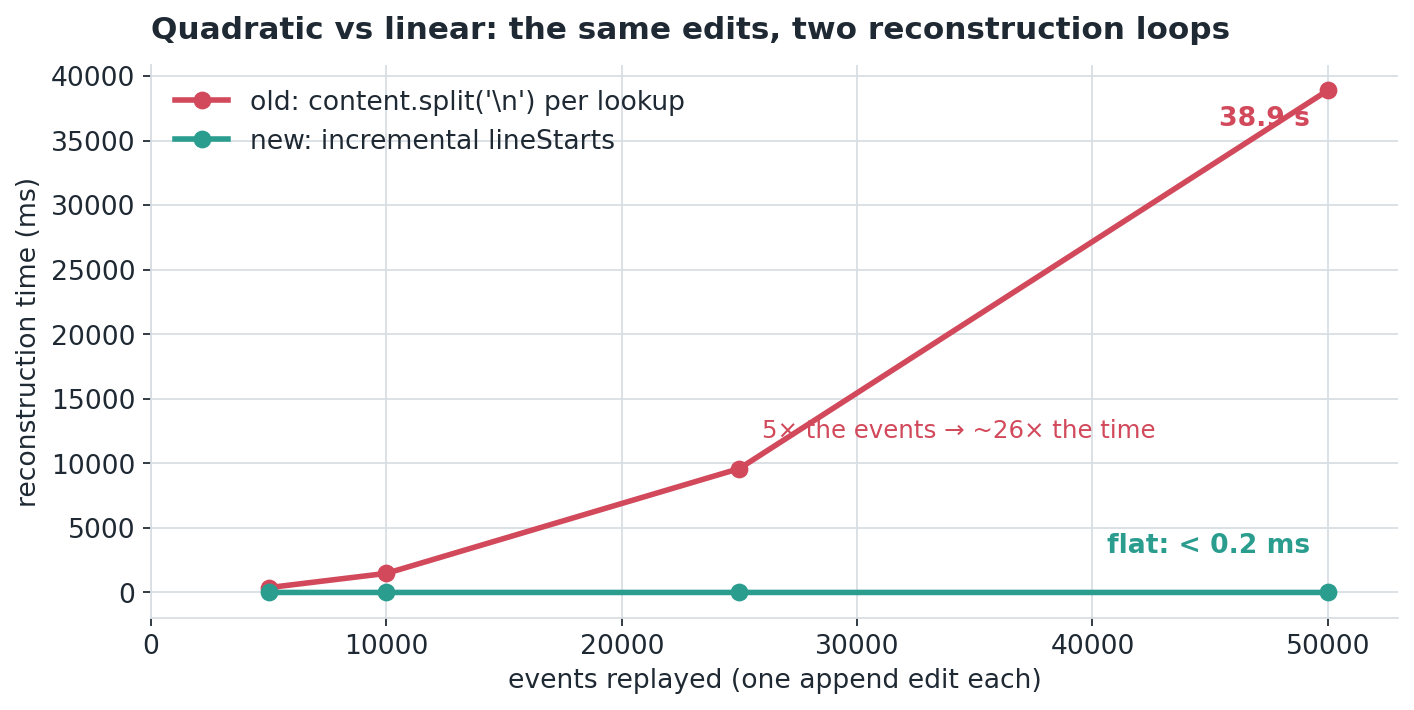
The exact bug in isolation: replay n append edits through the old <code class="language-plaintext highlighter-rouge">split('\n')</code>-per-lookup loop versus the incremental index. The old loop hits 38.9s at 50k events; the new one stays under a fifth of a millisecond. 5× the events gives ~26× the time, which is what quadratic looks like.</p>

<p>Same command, after the change:</p>

<div class="language-plaintext highlighter-rouge"><div class="highlight"><pre class="highlight"><code>$ INGEST_PROFILE=1 npm run profile:large -- 50000   # after the reconstruction fix

─── ingest profile · one 50k-event bundle ───
phase                    total     share
parse_bundle             0.22s      6.7%
create_submission        0.22s      6.7%
run_heuristics           0.16s      4.9%
compute_stats            0.06s      1.8%
run_validation           0.24s      7.3%
materialize_events       2.37s     72.0%
──────────────────────────────────────────
handler_total            3.29s
</code></pre></div></div>

<p>A 50k-event bundle went from about 132 seconds to about 3.3 seconds, roughly <strong>40×</strong>.<sup id="fnref:head" role="doc-noteref"><a href="#fn:head" class="footnote" rel="footnote">3</a></sup> The three formerly-quadratic stages all but vanished, and you can already see the cost sliding onto <code class="language-plaintext highlighter-rouge">materialize_events</code>, the actual database write.</p>

<p><img src="/assets/img/collapse-50k.png" alt="The three formerly-quadratic stages on a single 50k-event bundle, before and after the fix, on a log scale. Heuristics drops from 66.3s to 0.16s, stats from 47.7s to 0.06s, validation from 15.6s to 0.24s." /></p>

<p class="fig-caption">
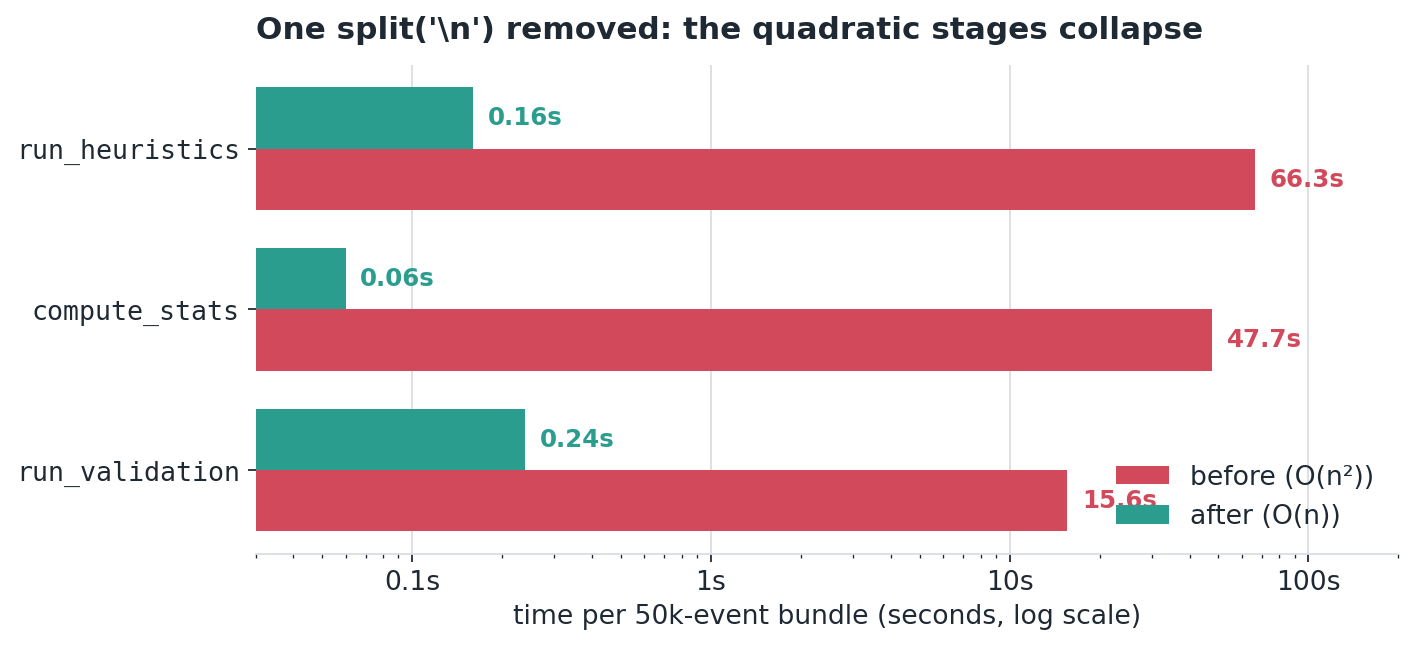
The three formerly-quadratic stages on one 50k-event bundle, from <code class="language-plaintext highlighter-rouge">profile:large</code>. Log scale, so each gridline is 10×. The database write (<code class="language-plaintext highlighter-rouge">materialize_events</code>, ~2.4s) was untouched and is what dominates now.</p>

<p>Once I was in there, I kept going. The row insert was the obvious next target. The old code chunked a parameterized multi-row INSERT a thousand rows at a time to stay under Postgres’s bind-parameter ceiling:</p>

<div class="language-ts highlighter-rouge"><div class="highlight"><pre class="highlight"><code><span class="k">for</span> <span class="p">(</span><span class="kd">const</span> <span class="nx">chunk</span> <span class="k">of</span> <span class="nx">chunks</span><span class="p">(</span><span class="nx">rows</span><span class="p">,</span> <span class="mi">1000</span><span class="p">))</span> <span class="p">{</span>
  <span class="k">await</span> <span class="nx">db</span><span class="p">.</span><span class="nx">insert</span><span class="p">(</span><span class="nx">events</span><span class="p">).</span><span class="nx">values</span><span class="p">(</span><span class="nx">chunk</span><span class="p">).</span><span class="nx">onConflictDoNothing</span><span class="p">();</span>
<span class="p">}</span>
</code></pre></div></div>

<p>I replaced it with a single <code class="language-plaintext highlighter-rouge">json_to_recordset</code> INSERT that passes the whole batch as one JSON parameter. (Drizzle expands an interpolated JS array into a placeholder list, which blows the parameter cap, so a single json string sidesteps the entire problem.) I also prototyped <code class="language-plaintext highlighter-rouge">COPY FROM STDIN</code>, the textbook fast path for bulk loads, and benchmarked it dead even with the JSON insert at ~1.6s, because both pay the same index-maintenance cost on the way in. So I dropped the COPY plumbing rather than carry complexity that bought nothing.<sup id="fnref:copy" role="doc-noteref"><a href="#fn:copy" class="footnote" rel="footnote">4</a></sup></p>

<p>A few smaller wins rounded it out:</p>

<ul>
  <li><strong>Build the event index once</strong> per submission and thread it through the stages, instead of every stage rebuilding it.</li>
  <li><strong>Worker concurrency</strong> to drain the job queue across cores. The 700-bundle import went from <strong>348s to 87s to 44s</strong> at concurrency 1, 4, and 8 on my 10-core box, close to linear. (You have to raise the DB connection pool alongside it, or the workers just starve each other for connections.)</li>
  <li><strong>Dropped a redundant index</strong> on the events table that was costing ~360ms per bundle of pure write overhead and buying nothing the primary key didn’t already give.<sup id="fnref:index" role="doc-noteref"><a href="#fn:index" class="footnote" rel="footnote">5</a></sup></li>
</ul>

<h2 id="boom-more-error">BOOM. More error.</h2>

<p>Feeling good about myself, I generated the real boss fight, 700 bundles at 50k events each, a 2.3 GB zip, and dragged it into the analyzer to upload. It died immediately.</p>

<p>My ingestion loaded the entire zip into memory before processing anything, and 2.3 GB sails straight past a ~2 GiB allocation ceiling buried in Node’s multipart parser.<sup id="fnref:undici" role="doc-noteref"><a href="#fn:undici" class="footnote" rel="footnote">6</a></sup> The error message was also a lie: a bare <code class="language-plaintext highlighter-rouge">catch</code> had been collapsing every failure into a generic “validation failed,” so I fixed that to surface the real cause while I was in there.</p>

<p>Two realizations came out of it:</p>

<ol>
  <li>If you’re running this locally, there’s no reason to do the whole upload-into-memory dance at all. I added a local-path ingest that reads the export straight off disk with a streaming ZIP reader, so peak memory is one rebuilt bundle rather than the whole archive. A 10 GB+ export is fine now.</li>
  <li>Eventually this is a server, though, so I started on streaming the upload to disk and <strong>resumable, 50 MB chunked uploads</strong>, because losing your connection 10 minutes into a multi-GB upload and watching the whole thing vanish is a genuinely miserable way to spend an afternoon.</li>
</ol>

<p>Along the way I also fixed a nastier little bug in the recorder itself. An edit made right after a save was getting logged as an external file change, because VS Code fires the change event <em>before</em> it flips the document’s <code class="language-plaintext highlighter-rouge">isDirty</code> flag, so the first edit on a just-saved buffer has the exact signature of a reload-from-disk.<sup id="fnref:recorder" role="doc-noteref"><a href="#fn:recorder" class="footnote" rel="footnote">7</a></sup> The fix gates that branch on a cheap synchronous disk check, and only on the first change after a buffer goes clean:</p>

<div class="language-ts highlighter-rouge"><div class="highlight"><pre class="highlight"><code><span class="c1">// a genuine reload converges to what's on disk; a real edit diverges from it</span>
<span class="k">if</span> <span class="p">(</span><span class="nx">reason</span> <span class="o">===</span> <span class="kc">undefined</span> <span class="o">&amp;&amp;</span> <span class="o">!</span><span class="nx">doc</span><span class="p">.</span><span class="nx">isDirty</span> <span class="o">&amp;&amp;</span> <span class="nx">readFileSync</span><span class="p">(</span><span class="nx">path</span><span class="p">,</span> <span class="dl">'</span><span class="s1">utf8</span><span class="dl">'</span><span class="p">)</span> <span class="o">===</span> <span class="nx">doc</span><span class="p">.</span><span class="nx">getText</span><span class="p">())</span> <span class="p">{</span>
  <span class="c1">// treat as external reload</span>
<span class="p">}</span> <span class="k">else</span> <span class="p">{</span>
  <span class="c1">// normal keystroke edit</span>
<span class="p">}</span>
</code></pre></div></div>

<blockquote>
  <p><em>Late-night addendum (2:19 AM):</em> I ran the full 2.3 GB ingest. It took <strong>35 minutes</strong>. For a while I was sure it had hung, but it was just grinding through final processing without telling the frontend. Lesson learned: kick it off and go do something else.</p>
</blockquote>

<h2 id="day-2-the-optimization-i-almost-missed">Day 2: the optimization I almost missed</h2>

<p>The next evening I found a sneakier version of the same kind of problem. My reconstruction was fast in the best case, when edits append to the end of the file, which is the pattern V8 keeps cheap and also, conveniently, the pattern all my benchmarks happened to use.</p>

<p>Real assignments don’t look like that. I remember my own CS 61A homework: you’re handed skeleton code with method signatures and you fill in the bodies, so almost every edit lands in the <em>middle</em> of the file. An interior edit in the old model copied the whole file body each time, which put me right back at O(L²) per reconstruction. And reconstruction runs about ten times per submission file, so it was ten interior quadratics stacked on each other, with heuristics taking the worst of it.</p>

<p>I added an edit-position knob to the benchmark so it could drop edits mid-file instead of at the end, with the same event count and same final file size. With edits landing in the interior the cost was <strong>5.6× higher at 10k events and 12.1× higher at 25k</strong> (3 seconds versus a quarter-second for a single reconstruction).</p>

<p>Two fixes. First, a line-cell content model: store the file as an array of lines, each with its own parallel per-character provenance, so an intra-line edit rewrites a single line cell in O(line length) with no whole-file copy and no separate offset index to maintain. (It does regress pure whole-line insertion, since that shifts the cell array, but real keystroke streams are overwhelmingly intra-line typing, so it nets out well ahead. If real bundles ever prove me wrong, the documented next step is a gap buffer over the cells, which makes even that case linear.) Second, reconstruct each file once and share the result across every stat and heuristic that needs it, instead of replaying it from scratch per consumer.</p>

<p>Those got the reconstruction-heavy stages <strong>3-4× faster on big files</strong>, and the win widens as files grow. Here’s the realistic workload measured at HEAD, infra-free, one <code class="language-plaintext highlighter-rouge">doc.change</code> per keystroke with an interior cursor:</p>

<div class="language-plaintext highlighter-rouge"><div class="highlight"><pre class="highlight"><code>$ BENCH_EDIT=methodfill npm run bench:stages -- 10000 50000

Absolute median ms per stage:

events       slogMB    fileKB     parse  buildIdx     stats     valid      heur   CPU sum
10,003          3.3       6.2      22.4       4.9       4.2      47.4       8.1      87.0
50,003         16.8      25.0     106.4      28.6      17.5     237.2      37.5     427.3

Normalized ms per 10k events (flat = linear, rising = super-linear):

events        parse  buildIdx     stats     valid      heur   CPU sum
10,003        22.37      4.87      4.22     47.41      8.12     86.98
50,003        21.29      5.73      3.50     47.44      7.50     85.46
</code></pre></div></div>

<p>The normalized columns are the thing to watch. Every one of them is flat from 10k to 50k events, which is what linear looks like. If reconstruction were still quadratic, the <code class="language-plaintext highlighter-rouge">stats</code> and <code class="language-plaintext highlighter-rouge">heur</code> columns would climb with size instead of holding steady.</p>

<p>I also handed Claude my actual CS 61A folder and the assignment format, and had it rebuild the fixture generator into a corpus-derived keystroke model: one <code class="language-plaintext highlighter-rouge">doc.change</code> per character, a real character mix, real auto-indent, ~3.5% newlines. Much more honest test data, and it confirmed the new code scales linearly where the old code went quadratic.</p>

<h2 id="the-part-where-the-bottleneck-moved">The part where the bottleneck moved</h2>

<p>Then I ran the real thing, full stack, against a fresh Postgres + MinIO. (Wiping the dev volumes first handed me back <strong>108 GB</strong> of accumulated test junk, which tells you something about how much CPU <em>and</em> disk this exercise had been quietly eating.) 700 bundles, 50k events each, 35 million event rows. It finished in about <strong>17.8 minutes</strong> at concurrency 8.</p>

<div class="language-plaintext highlighter-rouge"><div class="highlight"><pre class="highlight"><code>$ INGEST_PROFILE=1 npm run profile:ingest -- --path large-700x50000.zip
  # 700 × 50k, INGEST_CONCURRENCY=8, fresh Postgres + MinIO

─── ingest profile · avg per bundle (contended, c=8) ───
phase                    avg/bundle
handler_total              11.43s
├─ materialize_events       6.58s    ◄ 50k row inserts per bundle
├─ create_submission        2.10s
├─ parse_bundle             1.24s
├─ run_validation           0.78s
├─ run_heuristics           0.29s
└─ compute_stats            0.22s
─────────────────────────────────────
700/700 matched · 35,002,100 event rows · Postgres → 22 GB
end-to-end: 1068.6s ≈ 17.8 min  (0.66 bundles/s)
</code></pre></div></div>

<p>The reconstruction stages I’d spent the whole weekend on came in at under 2% of total ingest time. That sounds deflating until you remember those same three stages used to be about <strong>90% of a bundle that took two full minutes</strong>. Heuristics alone went from 66 seconds to 0.16; stats from 48 seconds to 0.06. It’s super easy to write-off that work as a rounding error until you take a step back and see that it’s the only reason a 23-hour import is now a 17-minute one. The reason it reads as 2% NOW is that flattening it uncovered the cost that had been sitting underneath the whole time: writing rows to the database.</p>

<p>Materializing 35 million event rows, with eight transactions all contending on the same table’s indexes, is about 76% of what’s left. That cost was always there, just hidden behind a problem fifty times bigger. My CPU-only benchmarks never touched the database, which is also why my earlier estimate for this run was 24× too optimistic.</p>

<p>One asterisk worth stating plainly: I’m running Postgres and object storage locally through Docker-for-Mac, whose VM layer is famously slow at disk I/O, so the absolute numbers are probably the pessimistic end. The shape of it, DB-write-bound rather than CPU-bound, is what I’d expect to hold on real infrastructure.</p>

<p>And honestly, that’s a fine place to be. The CPU pipeline is at its algorithmic floor now. The one irreducible cost left is hash-chain verification, which is the entire tamper-evidence guarantee and isn’t allowed to get faster.<sup id="fnref:chain" role="doc-noteref"><a href="#fn:chain" class="footnote" rel="footnote">8</a></sup> Everything past that is a database-throughput problem, which is a much more boring and well-trodden thing to fix than an O(n²) hiding in three files.</p>

<h2 id="the-loose-end-cross-flags">The loose end: cross-flags</h2>

<p>There’s one stage I haven’t beaten, the only truly super-linear one left. Cross-flags compares submissions against each other to catch shared pastes and cloned editing patterns, and it’s O(S²) in the number of submissions. On the 700×50k run it didn’t even finish inside my 5-minute poll window.<sup id="fnref:crossflags" role="doc-noteref"><a href="#fn:crossflags" class="footnote" rel="footnote">9</a></sup> It’s bounded by a small fingerprint per submission so it’s fine for normal cohorts, but at full fleet scale it’s the next thing to watch, and I’m torn on whether to optimize it now or shelve it until more people are on the project and can weigh in.</p>

<h2 id="what-i-actually-want-to-build-next">What I actually want to build next</h2>

<p>The honest answer is that I shouldn’t be running this as one giant batch in the first place. If Provenance connected to Gradescope directly and pulled each submission as the student turned it in, the whole hour-long-import problem dissolves into a trickle of one-bundle ingests spread across the assignment window, each taking a couple of seconds, with nobody waiting on it. I’ve worked a lot with Gradescope’s (undocumented, delightful) API on other projects (see: <a href="https://github.com/AFA-Tooling/remind">AutoRemind</a>), so a job that wakes up hourly, grabs new submissions, and ingests them feels very doable. It would also make populating the roster and the assignment list basically free.</p>

<p>For now, someone runs the import in the background and goes to lunch. It doesn’t need much babysitting, it just eats a frankly <em>ridiculous</em> amount of CPU and memory while it runs. The better way is incremental, and I know what it looks like; I just need the access and the green light to build it.</p>

<p>It was a long weekend. I killed a 40× quadratic, learned an embarrassing amount about how my own machine actually spends its time, and came out the other side knowing exactly where the next bottleneck is and what it’ll take to move it. I’ll take it.</p>

<div class="footnotes" role="doc-endnotes">
  <ol>
    <li id="fn:profiler" role="doc-endnote">
      <p>The flag has to be set before Node starts, not inside the script, because ESM evaluates imports before the module body runs, which cost me a confused half hour. The subtler trap: a stale <code class="language-plaintext highlighter-rouge">npm run dev</code> worker pointed at the same dev Postgres quietly steals jobs from the profiler’s in-process worker and runs them somewhere else, so the phases you’re trying to measure just never show up. I once found one that had been up for 22 days, eating my numbers the whole time. <a href="#fnref:profiler" class="reversefootnote" role="doc-backlink">&#8617;</a></p>
    </li>
    <li id="fn:lockstep" role="doc-endnote">
      <p>There are three copies because the replay logic lives in three places: a plain-content reconstructor (stats and a couple of heuristics), a variant that also tracks a parallel per-character provenance array (most heuristics), and an inlined copy inside validation’s doc.save-hash check. A property test runs them against each other on random streams and asserts byte-identical output, which is the only reason editing them in lockstep isn’t terrifying. <a href="#fnref:lockstep" class="reversefootnote" role="doc-backlink">&#8617;</a></p>
    </li>
    <li id="fn:head" role="doc-endnote">
      <p>That 3.29s is the snapshot right after the reconstruction fix and nothing else. The bulk-insert and index-drop work later in this post shaved it further, so reproducing at HEAD today lands around 1.9s, with <code class="language-plaintext highlighter-rouge">materialize_events</code> near 1.0s. Same shape, lower floor. <a href="#fnref:head" class="reversefootnote" role="doc-backlink">&#8617;</a></p>
    </li>
    <li id="fn:copy" role="doc-endnote">
      <p>The fiddly part of even trying COPY was getting the raw postgres.js client out of the Drizzle transaction (<code class="language-plaintext highlighter-rouge">tx.session.client</code>). Don’t wrap it back up with <code class="language-plaintext highlighter-rouge">drizzle(txSql)</code> to reuse the query builder, because the tx client has no <code class="language-plaintext highlighter-rouge">options.parsers</code> and you get a baffling “Cannot read properties of undefined (reading ‘parsers’)”. I worked all of that out, benchmarked it neck-and-neck with the plain JSON insert, and deleted the whole thing. <a href="#fnref:copy" class="reversefootnote" role="doc-backlink">&#8617;</a></p>
    </li>
    <li id="fn:index" role="doc-endnote">
      <p>Measured by inserting 50k rows with different indexes present: primary key alone ~104ms, +<code class="language-plaintext highlighter-rouge">(submission_id, kind, t)</code> ~153ms, +<code class="language-plaintext highlighter-rouge">(submission_id, session_id, seq)</code> ~517ms. That last index was ~360ms of pure overhead, and the primary key already orders rows by sequence, so it was dead weight. Bonus yak-shave: <code class="language-plaintext highlighter-rouge">drizzle-kit generate</code> is broken in this repo (a version mismatch), so I hand-wrote the migration and its journal entry, which turns out to be all the migrator actually reads. <a href="#fnref:index" class="reversefootnote" role="doc-backlink">&#8617;</a></p>
    </li>
    <li id="fn:undici" role="doc-endnote">
      <p>It’s not a limit anyone configured. Node’s <code class="language-plaintext highlighter-rouge">FormData</code>/undici parser concatenates the entire request body into one contiguous buffer, and somewhere around 2 GiB that allocation just fails with a <code class="language-plaintext highlighter-rouge">RangeError</code>, well under the batch-size cap I’d set. The fix detects that specific failure and returns a real 413 that points you at the local-path ingest, instead of pretending it was a validation error. <a href="#fnref:undici" class="reversefootnote" role="doc-backlink">&#8617;</a></p>
    </li>
    <li id="fn:recorder" role="doc-endnote">
      <p>While I was in there I also caught a test-isolation bug that had been lying to me: the helper that finds the recorded log file returned whatever the directory listing surfaced first, so a test could read a stale log from a previous run. It now picks the newest file by modification time. <a href="#fnref:recorder" class="reversefootnote" role="doc-backlink">&#8617;</a></p>
    </li>
    <li id="fn:chain" role="doc-endnote">
      <p>It’s about 44% of the remaining CPU, and it has to be. Detecting tampering means recomputing <code class="language-plaintext highlighter-rouge">sha256(prev_hash + JCS-canonicalize(envelope))</code> for every event and checking it still chains, where the JSON canonicalization is the expensive part. It runs exactly once per ingest and nothing else in the pipeline re-hashes, so there’s nothing to trim. You could shard it across worker threads, but that only helps the latency of one giant bundle, not the throughput of a class-sized import, which is the axis I care about. <a href="#fnref:chain" class="reversefootnote" role="doc-backlink">&#8617;</a></p>
    </li>
    <li id="fn:crossflags" role="doc-endnote">
      <p>The “didn’t finish” is a measurement artifact, not a result: my harness polls for cross-flag rows for five minutes and then shuts the worker down, which cut the computation off mid-run. It is genuinely slow at that scale, though, because the feature extraction streams every submission’s events back out of the 35-million-row table. It’s debounced to run once per semester rather than once per submission, so in normal use you don’t feel it. <a href="#fnref:crossflags" class="reversefootnote" role="doc-backlink">&#8617;</a></p>
    </li>
  </ol>
</div>]]></content><author><name>Aaryan Mehta</name></author><summary type="html"><![CDATA[Notes from a weekend spent profiling Provenance's submission ingest, finding an O(n²) bug that was hiding in plain sight, and chasing the cost around the pipeline until it finally landed on the database.]]></summary><media:thumbnail xmlns:media="http://search.yahoo.com/mrss/" url="https://blog.aaryanmehta.com/assets/img/quadratic-vs-linear.png" /><media:content medium="image" url="https://blog.aaryanmehta.com/assets/img/quadratic-vs-linear.png" xmlns:media="http://search.yahoo.com/mrss/" /></entry><entry><title type="html">The Cost of Efficiency</title><link href="https://blog.aaryanmehta.com/2026/03/09/the-cost-of-efficiency.html" rel="alternate" type="text/html" title="The Cost of Efficiency" /><published>2026-03-09T00:00:00+00:00</published><updated>2026-03-09T00:00:00+00:00</updated><id>https://blog.aaryanmehta.com/2026/03/09/the-cost-of-efficiency</id><content type="html" xml:base="https://blog.aaryanmehta.com/2026/03/09/the-cost-of-efficiency.html"><![CDATA[<p class="post-dek">On trading the wide-eyed excitement of a kid who drew dragons for the quiet competence of someone who can finally build them — and going looking for the dragons again.</p>

<p>I don’t remember the last time I was truly excited for something.</p>

<p>I don’t mean small-scale excitement. The brief, caffeinated rush of adrenaline you get before a game-winning roll in Catan, or the frantic seconds Gradescope<sup id="fnref:gradescope" role="doc-noteref"><a href="#fn:gradescope" class="footnote" rel="footnote">1</a></sup> takes to load after a midterm notification hits your inbox. I’m talking about genuine, prolonged excitement. The kind that acts as a physical weight pulling you out of bed; a reason to exist in the first place. I mean the sort of fire that isn’t just a short-lived burst of emotion, but a heightened sense of purpose that vibrates deep in your core during every waking moment.</p>

<p>The thing is: even though I may not remember when specifically I was last excited for something, I know that I most definitely used to be excited about things a lot back in the day. My mind goes back to elementary school. At this young age, having observed my father’s work as a software engineer, I had made it my life’s goal, my true singular purpose, to one day master the same languages he used to command machines, to use them to take my ideas and bring them into reality. Having not yet learned these foreign-seeming scripts and syntaxes, however, I instead temporarily settled for dealing with the first part of that idea-to-reality pipeline — coming up with concepts and fantasies that I one day hoped to translate into applications on a phone or computer.</p>

<p>And I took this seriously, much more seriously than one would imagine an elementary schooler would take the quite grown-up and mundane-sounding task of product design. Just like any other child at the time, I was absolutely enamored by the (to me) newly popular medium of mobile video games. Games like Subway Surfers, Fruit Ninja, and Jetpack Joyride had me begging my mom for an extra 10 minutes of time on her iPhone 6. However, more than all of these, there was one particular game that I was absolutely obsessed with — Dragon City, a game all about breeding and fighting (you guessed it!) dragons. One of the many titles from the Facebook-to-mobile ‘game factories’ of the 2010s,<sup id="fnref:factories" role="doc-noteref"><a href="#fn:factories" class="footnote" rel="footnote">2</a></sup> Dragon City had my eight-year-old self trapped in a loop of breeding and leveling up a pixelated roster of reptiles.</p>

<p><img src="/assets/img/dragon-city.jpg" alt="A promotional screenshot from Dragon City's Google Play store page: cartoon dragons perched on floating islands above a bright blue sky." /></p>

<p class="fig-caption">Dragon City, lifted straight from its Google Play store page. While formatting this post I went and searched it up, fully expecting a graveyard, and instead found the game alive and well in 2026, complete with a steady stream of Reddit threads still calling it a cash-grab a decade later. Some things are forever. Anyway, here’s a picture.</p>

<p>My obsession with this game combined with my interest in application design, and the next thing you knew it, the hours I had spent glued to my mom’s phone screen turned into hours spent holed up in my room with a notepad and a box of coloring pencils, furiously drawing and then crossing out screen layouts and writing out mechanics for my very own, dragon-themed game (look, I said I was motivated, not that I was creative. I’m sure that if you found and went through a lot of these scraps of paper, you’d find some pretty striking similarities between my designs and the designs of the game that had inspired them in the first place). I’d take these drawings to school, show them to all my friends, model playing out rounds of this game’s rudimentary combat system with them, and then spend more hours refining these mechanics at home just to go back and do it all over again the next day.</p>

<p>Yet, even though this process was incredibly repetitive, and despite my acute awareness that this game was most likely never going to be anything more than just some ideas in my head or on a few sheets of paper, I was genuinely excited to wake up every day and work on it. Every moment I spent not working on these designs, the thoughts of them floated around in the back of my head. I would be playing cricket outside with my friends when I’d randomly come up with an idea for a new dragon to add to the game, and I’d find myself sprinting home mid-game to jot down a rough sketch of its form and abilities before I forgot about them. This game (which I dubbed Dragomania<sup id="fnref:dragomania" role="doc-noteref"><a href="#fn:dragomania" class="footnote" rel="footnote">3</a></sup>) became my life.</p>

<p>And even as I eventually grew out of drawing out game screens in my notepad, my excitement and fascination with the tasks I was working on followed me as I grew older. And actually, so did dragons! In early middle school, my friends and I started an “agency” called NoteArt, where we would draw these intricate designs and patterns onto the covers of our fellow classmates’ standard school-issued notebooks, in return for a small payment which we then put towards buying potted plants to donate to our school’s plant nursery. I once again spent every instant of my free time working on these designs, adding new patterns and elements to my ever-growing repertoire of motifs. But the crown jewel of my collection, the one design that I spent weeks on, was the NoteArt logo — a simplistic drawing of a dragon that I named “Note” (once again, really creative of me) that I would draw in the corner of every page that NoteArt ever customized for its so-called customers. I still remember every sharp edge and every curve of that design, the shade of teal I’d use for its wings, and the stylized font in which I would write the NoteArt name below every drawing of the dragon.</p>

<p>And this thread of obsession didn’t just stop at game design or notebook doodles. By early high school, my creative outlet had shifted from the visual to the verbal; I spent months painstakingly crafting a novel, pouring every ounce of my spare time into a world built of words. And yet, even in this new, more “mature” endeavor, I found myself returning to the same source of power. I made sure to give my main character his own dragon friend, on whose back he soared through the skies during one of the most important scenes in the plot line. I can feel the rush of that thrill — the way my fingers flew across the keyboard as I tried to capture the rush of the wind and the sheer, unadulterated freedom of flight. It was the same feeling I had in that cricket field years prior, the same spark that kept me awake under my covers with a metallic gel pen in my NoteArt days.</p>

<p><img src="/assets/img/book-cover.jpg" alt="The cover of the novel I wrote in high school." class="portrait" /></p>

<p class="fig-caption">The novel in question, which somehow ended up real enough to have a cover and sit on Amazon. The dragon shows up about two-thirds of the way in, exactly where you’d expect a teenager to put one.</p>

<p>But somewhere between that manuscript and the present day, the dragons stopped showing up as often. As I finally began to master the “scripts and syntaxes” my father used, the world became less about the <em>what</em> and more about the <em>how</em>. The “heightened sense of purpose” I felt while creating slowly made room for a series of high-stakes, “small-scale” stresses. I started thinking less about what would be cool and more about what would be efficient. My sense of accomplishment shifted from the internal joy of finishing a dragon’s wing to the external relief of seeing “All Public Tests Passed” show up on my Gradescope assignment page. Somewhere along the way, I started taking my goals so seriously that I sometimes forgot to actually enjoy the pursuit of them.</p>

<p>The truth is, I have the tools now that my eight-year-old self would have killed for. I can speak to the machines. I can build the reality. But lately I’ve leaned on the steady competence of the technician far more than the wide-eyed excitement of the dreamer. Most days I’m not sprinting home to jot down a sketch; I’m walking to class, checking my emails, and waiting for the next midterm score to tell me how to feel.</p>

<p>It is a strange sort of nostalgia, missing a version of yourself that’s still technically here. I have the hands that drew those wings; I have the mind that built those worlds; I finally have the “scripts and syntaxes” I once thought were the keys to the kingdom. But the kingdom itself has gone quiet. The dragons didn’t die in a flash of fire or a dramatic exit; they just slowly thinned out, becoming more transparent with every class I took and every line of efficient (gotta love a function that runs in O(1)<sup id="fnref:bigo" role="doc-noteref"><a href="#fn:bigo" class="footnote" rel="footnote">4</a></sup>) code I wrote, until some days I could see right through them to the plain reality of a career path.</p>

<p>I used to think that the tragedy of growing up was losing your tools to be creative and excited, you know? The time, the crayons, the imagination. But I think the trickier version is having the tools and forgetting, for a while, what you wanted to build with them. I can speak to the machines now, more fluently than I ever dreamed. The harder part is remembering I have things I actually want to say to them.</p>

<p>Lately, though, I’ve been trying to read that forgetting less as a verdict and more as something I can do something about. The quiet bothers me, and I think the fact that it bothers me is a good sign. You don’t get annoyed at an empty sky unless some part of you still wants something to be flying around up there.</p>

<p>And the more I think about it, this “essay”<sup id="fnref:essay" role="doc-noteref"><a href="#fn:essay" class="footnote" rel="footnote">5</a></sup> is probably the closest I’ve gotten to the old feeling in a while. Nobody assigned it. There’s no test to pass, no big green checkbox waiting at the end to tell me I did the right thing. I wrote it because I wanted to, which is the same reason I used to fill notepads with dragons.</p>

<p>So, I’m here. I’m capable. I’m a builder. The sky’s a lot quieter than it was when I was eight, and most days I’m still just walking to class. But the other night I caught myself sprinting home to write this down. I’d forgotten I still did that.</p>

<div class="footnotes" role="doc-endnotes">
  <ol>
    <li id="fn:gradescope" role="doc-endnote">
      <p>For anyone who hasn’t suffered through a CS class: Gradescope is the autograder that most of my assignments run on. You submit your code, it runs a battery of (both hidden and public) tests, and a few seconds later it decides how your evening is going to go. <a href="#fnref:gradescope" class="reversefootnote" role="doc-backlink">&#8617;</a></p>
    </li>
    <li id="fn:factories" role="doc-endnote">
      <p>A whole genre of the early 2010s: studios that spun up dozens of “breed-and-battle” or “build-and-wait” titles on Facebook and then ported them to mobile, all running on roughly the same loop of timers and soft currency. As a kid I just thought they were magic. In hindsight they were extremely well-tuned Skinner boxes, which, honestly, respect. <a href="#fnref:factories" class="reversefootnote" role="doc-backlink">&#8617;</a></p>
    </li>
    <li id="fn:dragomania" role="doc-endnote">
      <p>Naming a dragon game “Dragomania” is the kind of branding decision you can only make at eight. I stand by it completely. <a href="#fnref:dragomania" class="reversefootnote" role="doc-backlink">&#8617;</a></p>
    </li>
    <li id="fn:bigo" role="doc-endnote">
      <p>O(1) means “constant time” — the operation takes the same amount of time no matter how big the input gets. It’s the gold standard of efficiency, and there is a genuinely satisfying little hit of dopamine when you manage to get something down to it. That hit is real; it’s just a different shape than the one I’m writing about here. <a href="#fnref:bigo" class="reversefootnote" role="doc-backlink">&#8617;</a></p>
    </li>
    <li id="fn:essay" role="doc-endnote">
      <p>If you can even call it that. The word “essay” has always messed with me just a little. It implies an assignment to complete, a structure to follow. Most importantly, however, it’s always felt to me like it implies some kind of pending trial: a judgmental teacher reading through it, leaving red ink in the margins and a number at the top to tell me how I did. This has none of that. Nobody’s grading it, there’s no rubric, and the only person deciding whether it was worth writing is me. Which, now that I type it out, is sort of the entire point. <a href="#fnref:essay" class="reversefootnote" role="doc-backlink">&#8617;</a></p>
    </li>
  </ol>
</div>]]></content><author><name>Aaryan Mehta</name></author><summary type="html"><![CDATA[On trading the wide-eyed excitement of a kid who drew dragons for the quiet competence of someone who can finally build them — and going looking for the dragons again.]]></summary></entry></feed>